Now that you have scanned and received your results, let’s review the data and learn more about how you can use the features available to analyze it.
Note:While it is easier and more comprehensive to review scan data in SCiO Lab, SCiO Lab Mobile can also be used for this purpose.
Click the data collection to view the summary data for the collection.
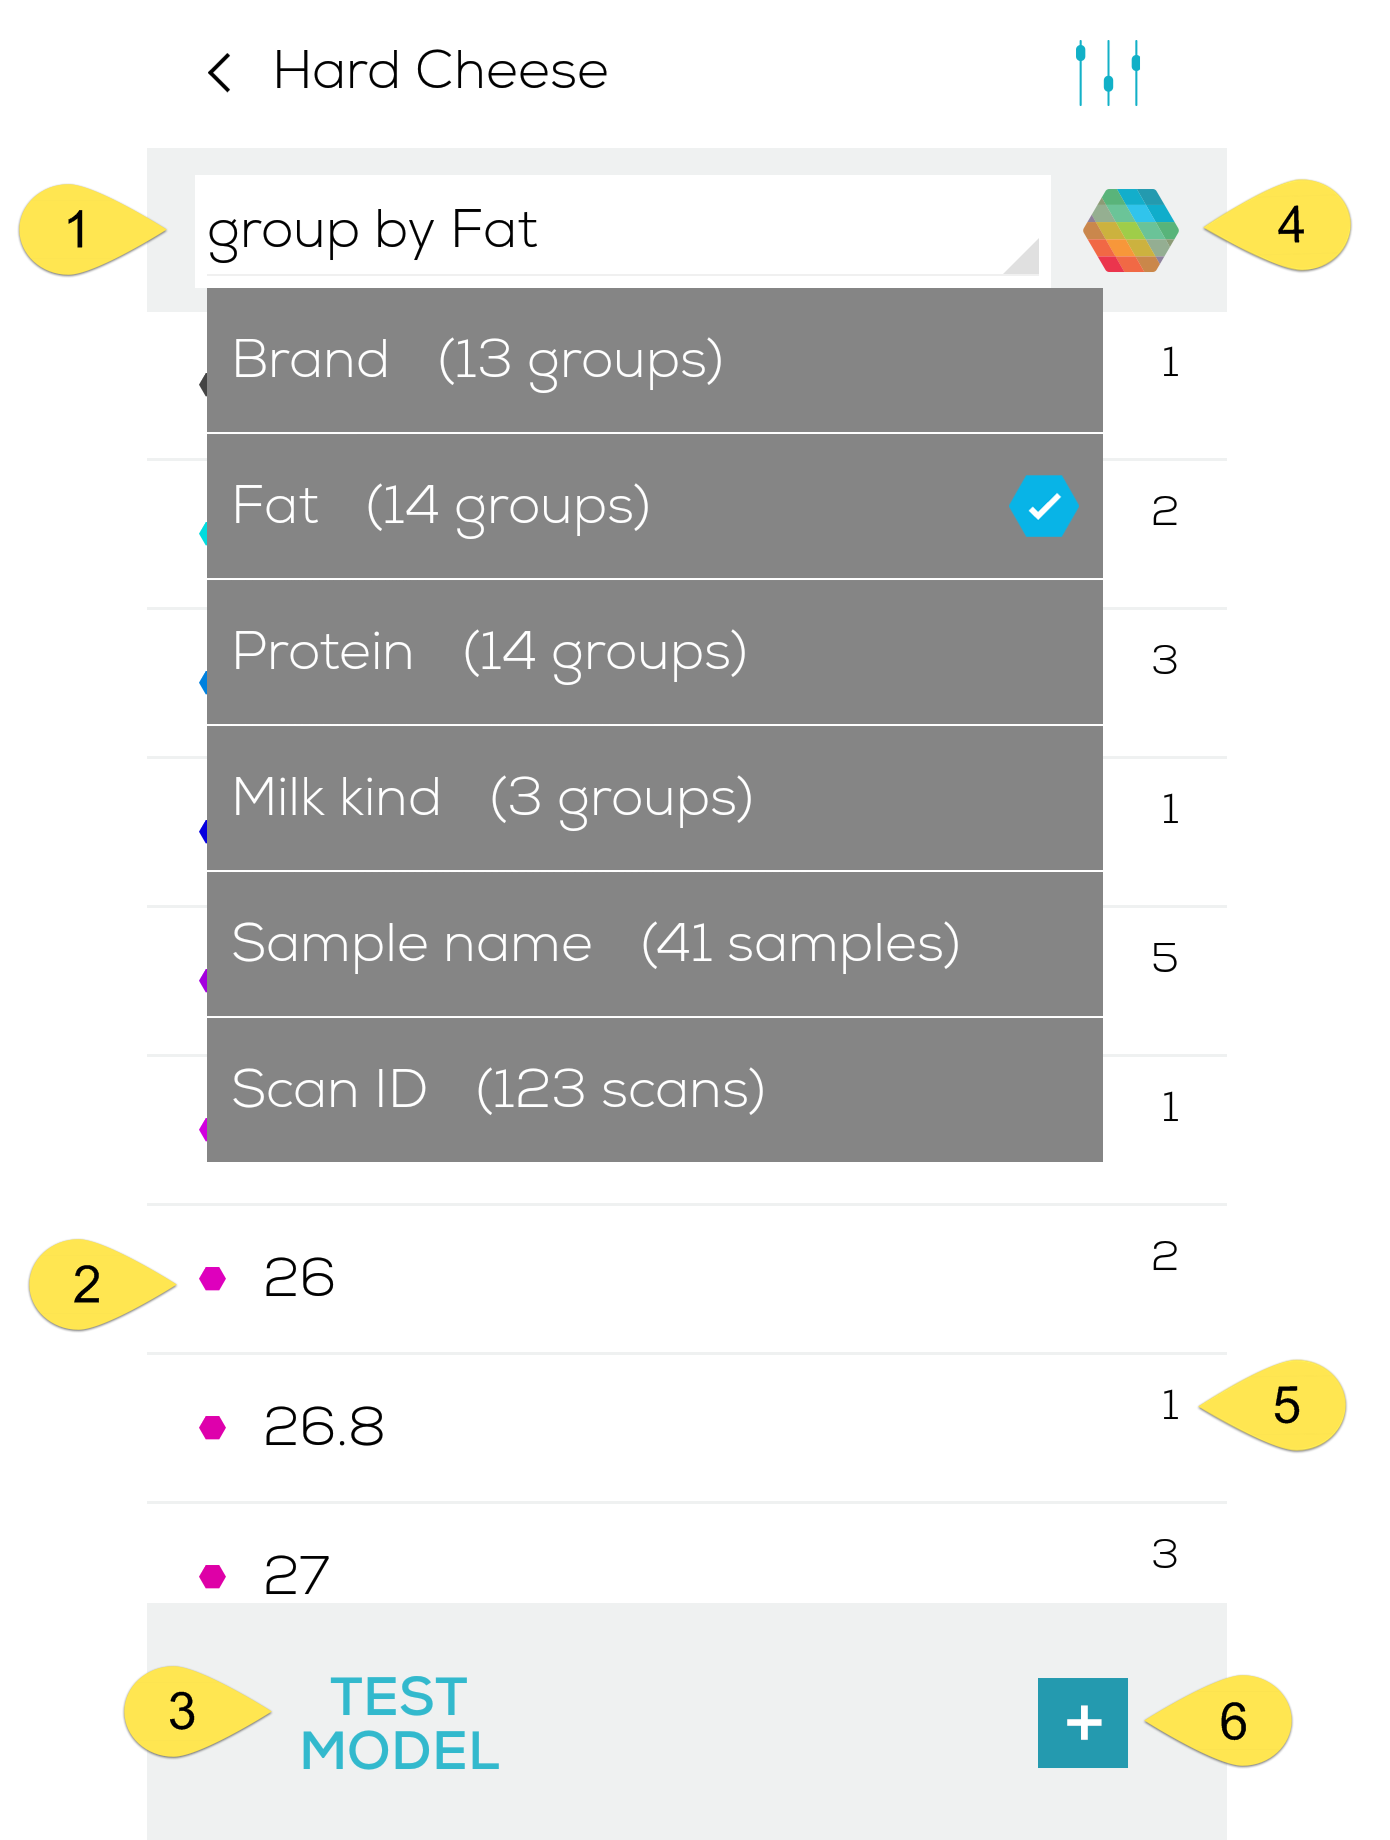
Understanding the Data Collections summary screen.
- Select the attribute in the drop-down list to group the scan data by. (In this case, we group by Fat).
- The attribute description. In this case, the percentage of fat in the sample material.
Tip: Use meaningful names for your attributes. - Click Test Model to test a model you’ve already created on a new sample.
Note: Test scans are not added to the collection. - Click the Spectra icon to go to spectra view.
- The total number of scans for that attribute.
- Click + to add new scan data.
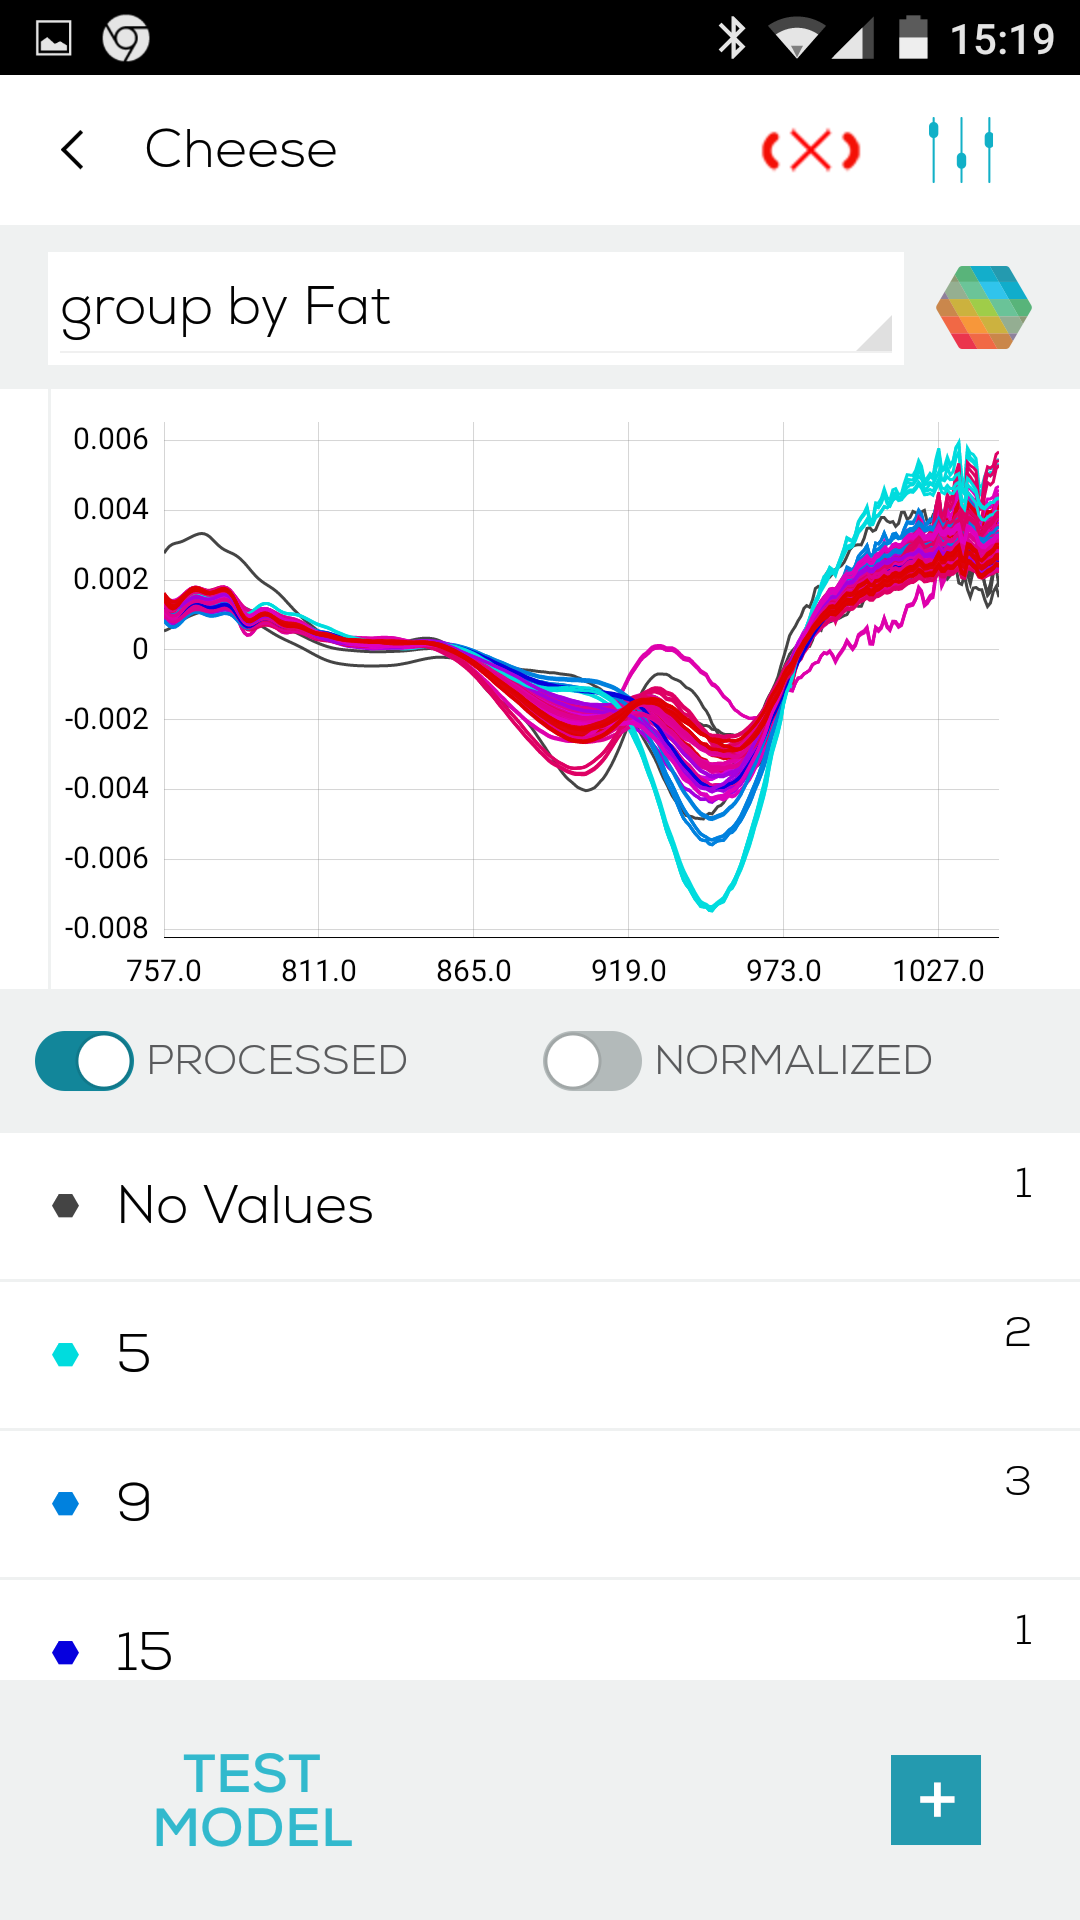
Clicking the Spectra icon displays the spectra details
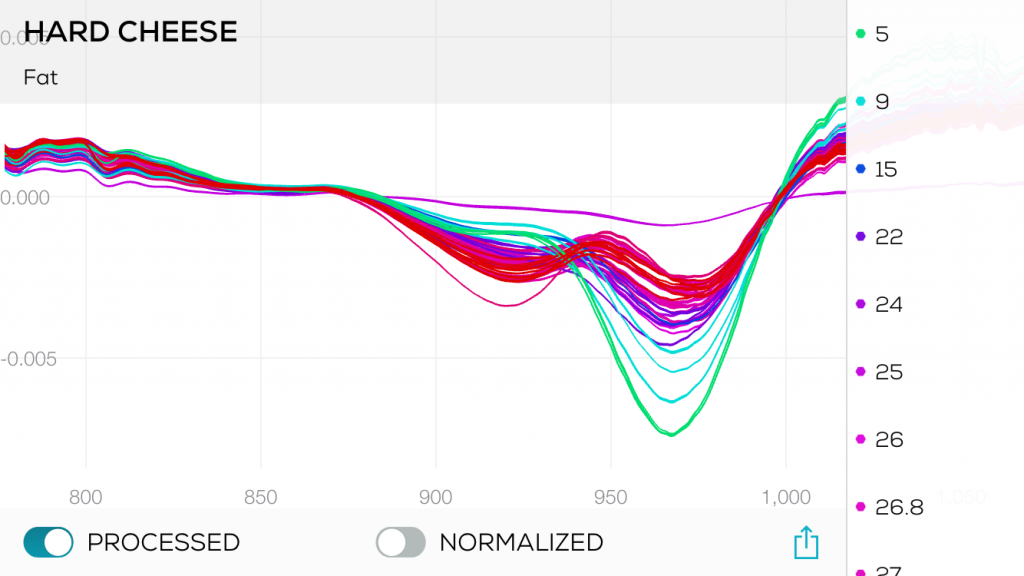
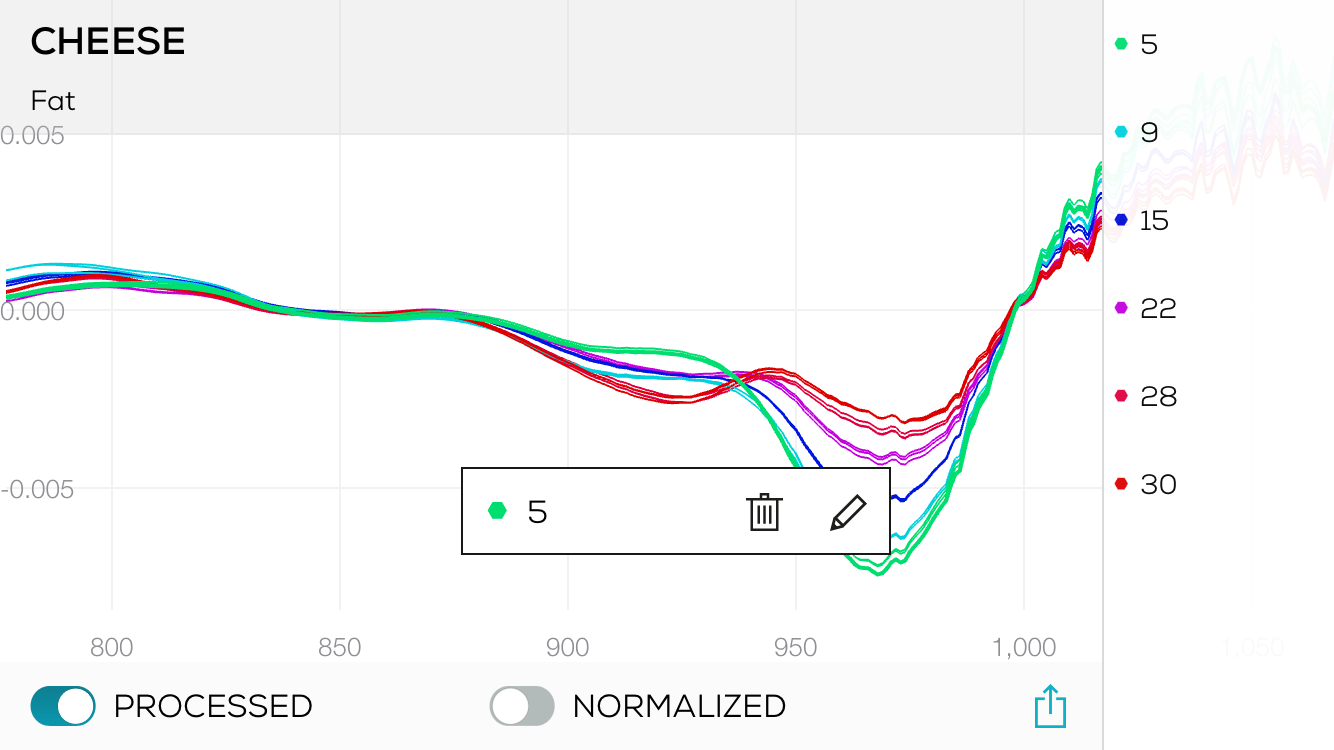
Tip: When you rotate your phone to landscape view, SCiO Lab Mobile provides a legend shows you the spectra with the processing algorithms. Tapping the standard share icon will also allow you to share the scan. The spectra legend and spectra share functionality are not available in portrait mode.


