PCA stands for Principle Component Analysis. It is a common tool in machine learning in general, and even more in chemometrics. PCA is a technique used to emphasize variation and bring out strong patterns in the spectra (read more about it here). In SCiO Lab, PCA is used to make data easier to explore and visualize by reducing the whole spectrum from a vector of 330 values (one per wavelength) to a shorter vector (typical 3-6 values), without losing too much of the information stored in the original spectrum.
For example, let’s look at the following data collection of four medicine types
Looking at the spectra, only three are observable.
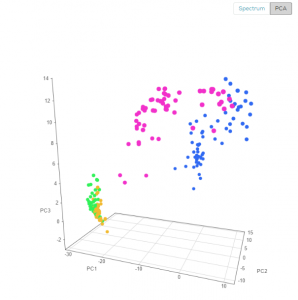
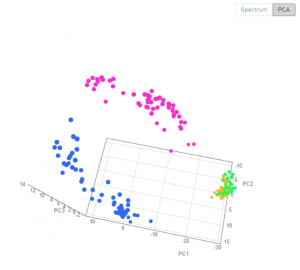
Using the PCA view, each spectrum is visualized as a point in 3D space (you can rotate the view to better see the difference between types), you can clearly see the four different medicines, the blue and purple are well separated, while the green and orange are somewhat overlapping.
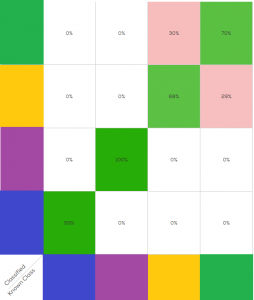
From the PCA view, one can project that a classification model on this data will work well on the blue and purple, but will have some difficulty discerning green from orange. The next figure shows the expected performance of the classification model (AKA “confusion matrix”)
As expected, two medicines (blue and purple) are easily distinguished, and two (green and orange) have some confusion between them.


