PCA stands for Principle Component Analysis. It is a common tool in machine learning in general, and even more in chemometrics. PCA is a technique used to emphasize variation and bring out strong patterns in the spectra (read more about it here). In SCiO Lab, PCA is used to make data easier to explore and visualize by reducing the whole spectrum from a vector of 330 values (one per wavelength) to a shorter vector (typical 3-6 values), without losing too much of the information stored in the original spectrum.

For example, let’s look at the following data collection of four medicine types

spectra


Looking at the spectra, only three are observable.

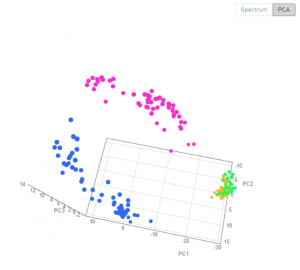
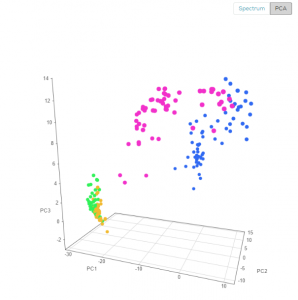
Using the PCA view, each spectrum is visualized as a point in 3D space (you can rotate the view to better see the difference between types), you can clearly see the four different medicines, the blue and purple are well separated, while the green and orange are somewhat overlapping.

PCA1                        PCA3


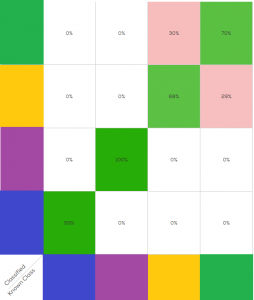
From the PCA view, one can project that a classification model on this data will work well  on the blue and purple, but will have some difficulty discerning green from orange. The next figure shows the expected performance of the classification model (AKA “confusion matrix”)


classification


As expected, two medicines (blue and purple) are easily distinguished, and two (green and orange) have some confusion between them.

 

Latent variables can be regarded as the real information hiding in the spectra. Too many latent variables can result in an over-fitted model that will not work well on new samples.
When models are created, an optimization process decides how many latent variables will be used in the model. The default range of latent variables is 1-5 (the maximal number of LVs is limited to 20% of the number of samples).
Using the expert mode, you can choose which number of LVs to use in the optimization process by writing a new range using ‘-‘ or discrete values separated by ‘,’.

For example, if you create a simple model for mixtures of material A and material B, one LV for each material should be enough to capture the information hidden in the spectrum.

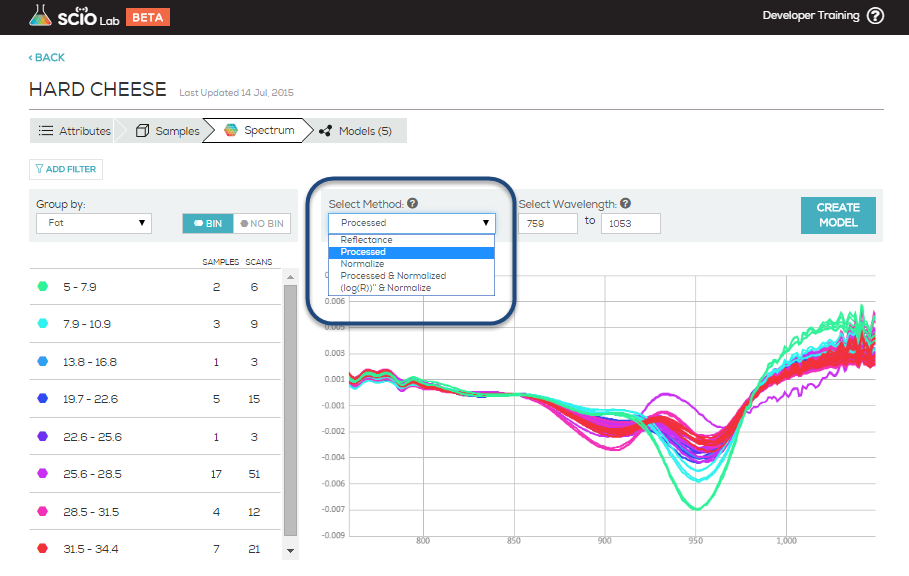
When viewing the scans of a data collection, the preprocessing method options allow you to view your data collection spectrum with different algorithms applied. These can help you identify outliers, inaccurate scans and reveal possible relationships in your data.


Within the graphs SCiO Lab Mobile presents:
X is the wavelength represented in nm (nanometers).
Y is dependent on the selected preprocessing method you choose.
When:

  • Reflectance is selected: Raw reflectance spectrum.
  • Processed (only): Assumes Beer-Lambert model is valid, and transforms the measured signal to be linear with concentration by doing a log transform and adjusting the result for noise and deviations from the model. You can learn more about Beer-Lambert here
  • Normalized (only): Performs normalization of the signal. This is meant to compensate for changing measurement conditions (e.g. varied scanning distances) that typically occur from sample to sample. Y axis still means reflectance but in normalized units instead of raw reflectance.
  • Both Processed and Normalized: First assumes Beer-Lambert model (Processed) and then normalizes the results to compensate for differences in the optical path between samples. This is useful, for example, when there is variation in the thickness of the samples.
  • Both (log)R))” and Normalized: Similar to Processed and Normalized, uses a more aggressive form of Processed. Adds more noise, but in some cases may be the only way to create a good model.

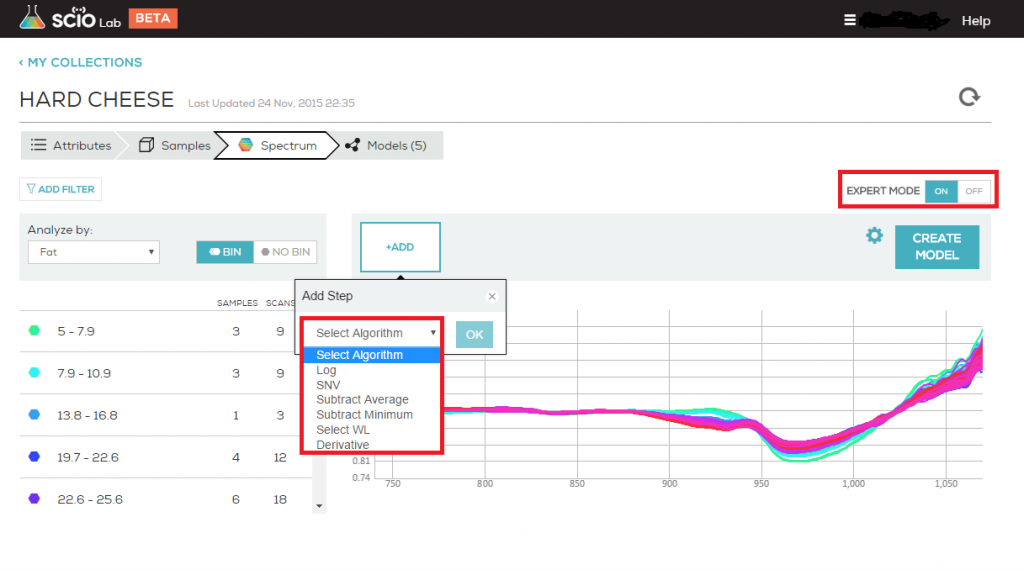
When Expert Mode is activated you can define your own preprocessing methods

expert_mode_preprocessing

When:

  • Log is selected – takes the natural logarithm of each value in the spectrum.
  • SNV – calculates and subtracts the average of each spectrum and divides it by the standard deviation thus giving the sample a unit standard deviation (s = 1).
  • Subtract Average – means subtracting the average-over-wavelength from each point of the spectrum to eliminate remaining trends after log+derivative, or to eliminate the gain (lambda independent gain) after log. So for example, if the spectrum fluctuates between 3 and 1, after “subtract average” you’ll get the same spectrum, only this time it will fluctuate between +1 and -1.
  • Subtract Minimum – means subtracting the minimal value (same value for all the points) from each point in the spectrum, so now, the spectrum “touches” the point zero at its minimum. Now, if the original spectrum fluctuates between 3 and 1, the spectrum after “subtract minimum” will fluctuate between 0 and 2. This is useful when you want to have the spectra on the same baseline without having negative values.
  • Select WL – choose the wavelength to use in the next step of analysis.
  • Derivative – takes the 1st or 2nd derivative of the spectra. Derivatives of spectra are useful for two reasons: 1. First, and second derivatives may swing with greater amplitude than the primary spectra. For example, a spectrum suddenly changes from a positive slope to a negative slope, such as at the peak of a narrow feature. The more distinguishable derivatives are especially useful for separating out peaks of overlapping bands. 2. Derivative spectra can be a good noise filter since changes in baseline have negligible effect on derivatives.

Typically, different models and types of samples will require different preprocessing methods. You should  choose both the preprocessing method to match your experimental setup and optimize the performance of your model. If you planned and gathered your data correctly, these efforts will coincide.

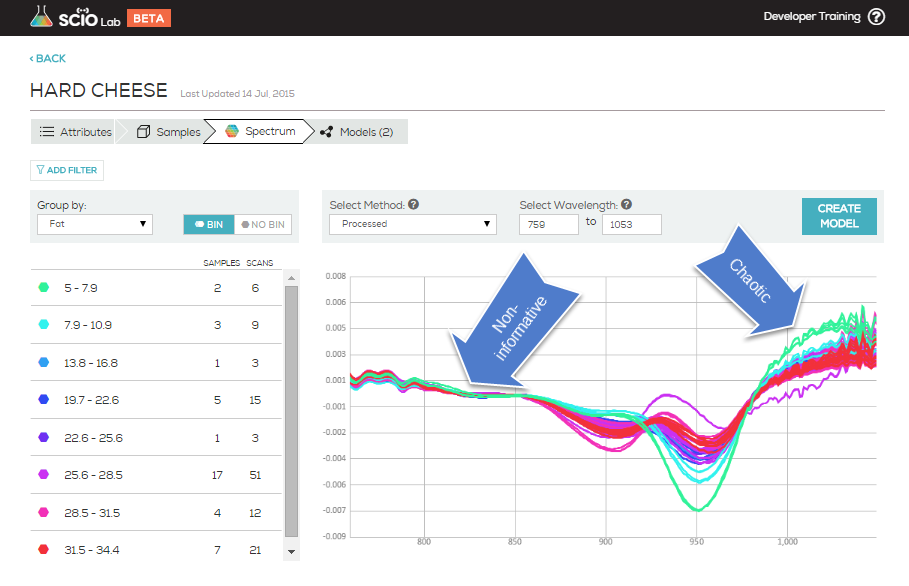
Filtering spectra or wavelengths is the means of ignoring wavelength “noise” and building your model on the more integral part of the spectrum. Within the spectrum of a data collection, there will be segments which show chaos and segments which show clear variance. Our goal when filtering is to exclude the chaotic and non-informative parts and focus on the area with clear variance.
This helps create better models that have:

  • Less LVs (latent variables), resulting in models that are more robust.
  • Smaller error and better performance parameters (R2, F1).
  • Better error distribution (condensed around the black line).

The following example, taken from the default Hard Cheese collection, Spectrum tab view, shows the entire wavelength of the data collection filtered by fat. You can see easily the areas that included too much chaos or too much non-informative data to be useful when creating a model.


Hard Cheese_wavelength 1

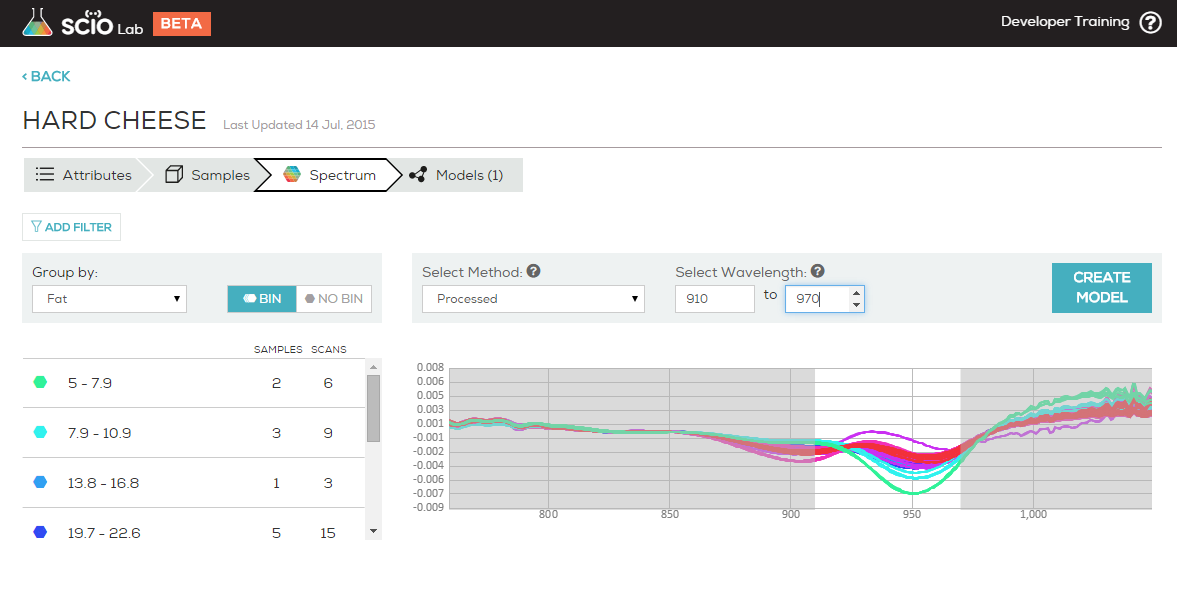
The second example shows the same collection filtered to a range of 910-970 and preprocessed using Processed.
Here, you can easily identify the clear, logical variance of the samples (low fat spectra at the top, high fat at the bottom) and the strength of the model this collection will build.


Hard Cheese_wavelength 2


Hard Cheese_wavelength 3

Tips:

  1. Removing noisy parts of the spectrum or focusing on ranges that look informative will typically improve your results significantly.
  2. Check a few different wavelength ranges when creating your models for best results.


Scan each sample 3 times resulting in approximately 120 scans (40 samples x 3 scans each sample). Examine the matrix via SCiO Lab to determine if the scatter plot is accurate or has wide variance.

To examine the matrix:

  1. Select the attribute you want the model to be analyzed by and click Create Model.
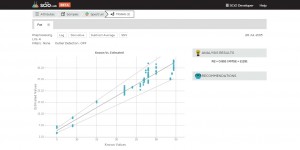
  2. The first image below shows a good model, where the scatter plot is accurate.
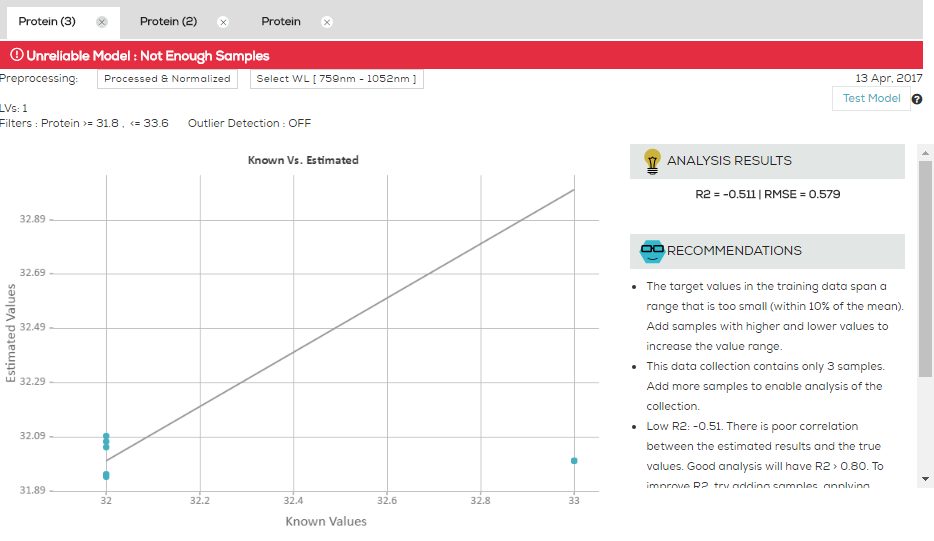
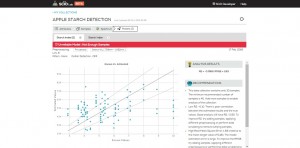
  3. The second image below shows a poor model. Use the toggle buttons to see the scans from different perspectives and help you discover your invalid records, pinpoint the variances and outliers and help you find the problems preventing success.
  4. SCiO Lab provides suggestions for improvement on every model. Follow those suggestions to improve your model, or contact us at dev@consumerphysics.com if you need help with your analysis.


Good Model


Poor Model

Once you have a working model, try creating and extending the model by introducing variations such a different temperatures and lighting. The more variation on a successful model, the stronger and more stable it will be for developing your future applications.

What Next?

Once feasibility is proven, the next step is to create a larger database of samples. Larger data collections result in more stable chemometric models.

Tip: Remember that your chemometric model can only ever be as good as your source data, both spectrum and metadata.

Now that your data collection has been completed, observed, and scrubbed, it is time to actually create your model. Click Create Model and you’ll be presented with a visual guide as to the success (or failure) of your model. You’ll also receive suggestions from us as to what can be improved.

Note: Some iteration may be required before you get a successful model.

Successful Estimation Model

Successful estimation model

R¬2 is >0.8, most of the data points are within the 20% error margin (light gray lines)

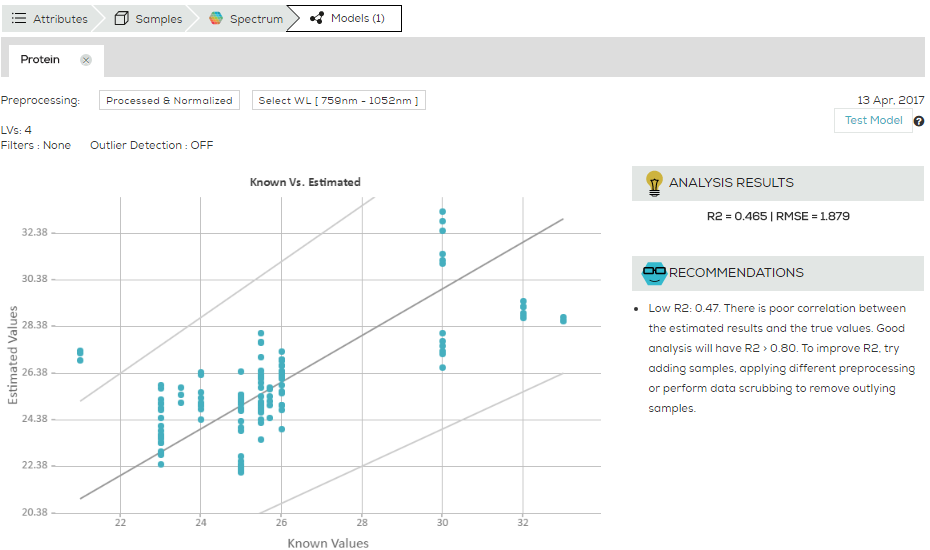
Unsuccessful Estimation Model

Unsuccessful estimation model

Low R2, random scatter of data points (no trend)

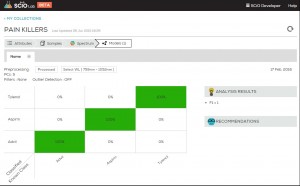
Good Classification Model

Good Classification Model

Diagonal is bright green, no red blocks meaning no confusion between types. F1 is 1 (perfect score)


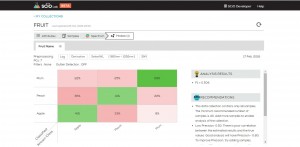
Poor Classification Model

Poor Classification Model


There is a mix of red & green blocks showing a  lot of confusion between types


If you need help with your analysis, you can always contact us at dev@consumerphysics.com. Remember that by asking for our help with model or data collection analysis means you grant us permission to access your SCiO Lab account to help you.

Data Scrubbing is the process by which noise, outliers and mistakes are identified and eliminated. Data scrubbing is required for accurate modeling.

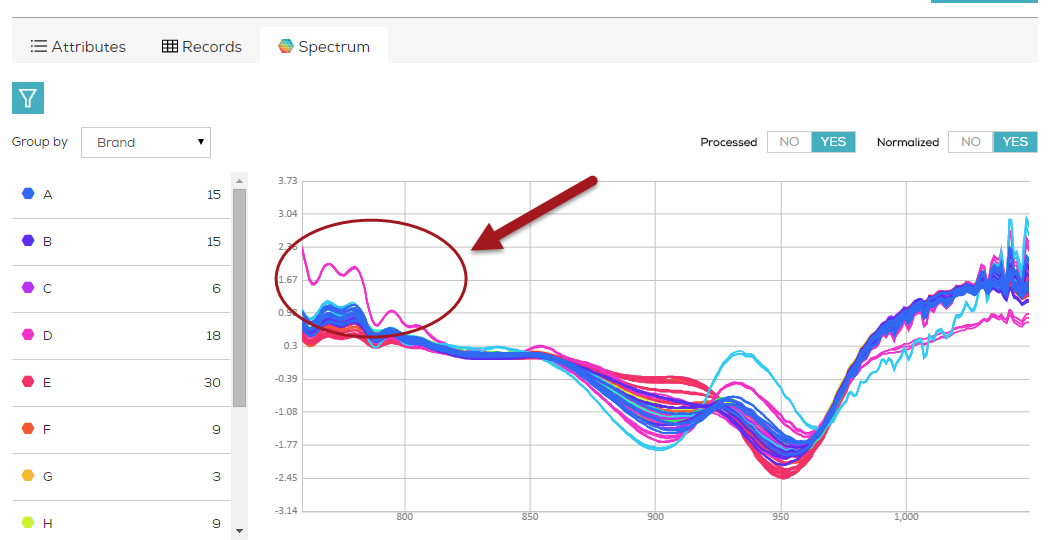
Using the records and spectra views, fix any meta-data errors and remove or address the chart outliers. Use the processed and normalized filters to help you find the outliers in the spectra. In the screen below, the outliers are highlighted.
Data Scrubbing_Spotting Outliers

Data scrubbing and Model Creation are an iterative process.
In order to build the best models, data scrubbing should be done until the outliers and anomalies are removed from your collection.

Once you have sufficiently scrubbed your data, it is time to create the model.

While both SCiO Lab Mobile and SCiO Lab can be used to observe data, SCiO Lab is easier to use for this purpose as the view screen is larger, and you can download your data and build models only from SCiO Lab.

Multiple views are available to observe the data:

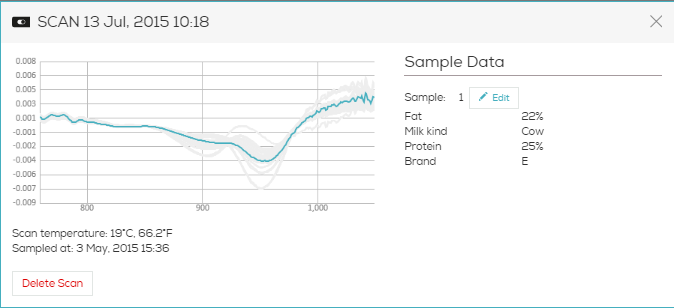
Scan View
Single Record_Hard Cheese

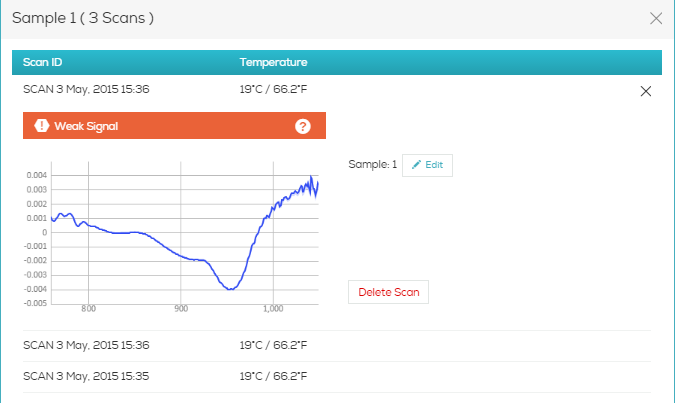
 Sample View

Observing data_screen2

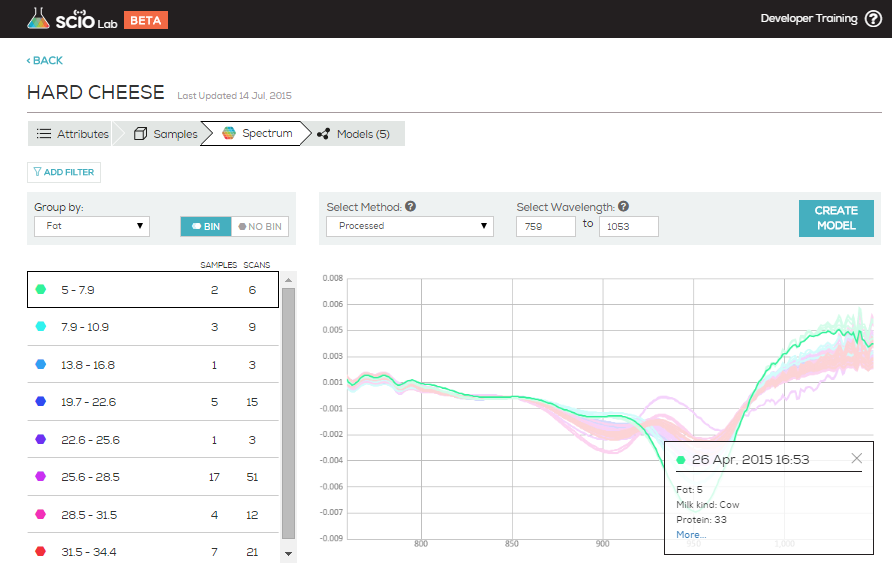
 Spectrum View

Observing data_screen2

Use the scan view and check for accuracy in each scan. Use the sample view to see multiple scans of the same sample at one time.  The accuracy of your attributes is critical to the success of your model.
Use the spectrum view to look for outliers and see trends.

Once you have observed your data, the next step is to scrub it.