Now that your data collection has been completed, observed, and scrubbed, it is time to actually create your model. Click Create Model and you’ll be presented with a visual guide as to the success (or failure) of your model. You’ll also receive suggestions from us as to what can be improved.
Note: Some iteration may be required before you get a successful model.
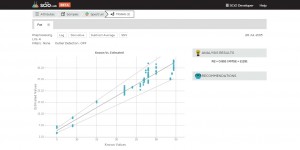
Successful Estimation Model
R¬2 is >0.8, most of the data points are within the 20% error margin (light gray lines)
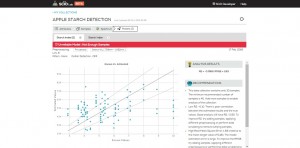
Unsuccessful Estimation Model
Low R2, random scatter of data points (no trend)
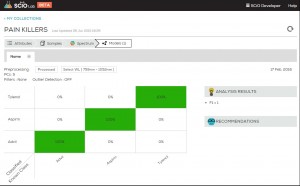
Good Classification Model
Diagonal is bright green, no red blocks meaning no confusion between types. F1 is 1 (perfect score)
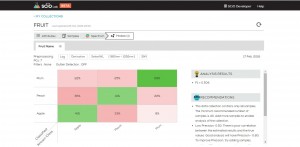
Poor Classification Model
There is a mix of red & green blocks showing a lot of confusion between types
If you need help with your analysis, you can always contact us at dev@consumerphysics.com. Remember that by asking for our help with model or data collection analysis means you grant us permission to access your SCiO Lab account to help you.


Leave a Reply
You must be logged in to post a comment.